Suggested Workflow
This section does not contain any design requirements (i.e. you could complete the whole project without reading this section). However, we’ve compiled our general guidelines for design, development, and testing.
Design Workflow
This project has a lot of moving parts, and it’s normal to feel overwhelmed by the amount of requirements you need to satisfy in your design. Here is one suggestion for how you can break down this project into more manageable steps:
- Read through the entire spec. It’s easy to miss a design requirement, which might cause you trouble later when you have to redo your design to meet the requirement you missed. We suggest reading through the entire spec front-to-back at least twice, just to make sure that you have internalized all the design requirements.
- Design each section in order. Start with user authentication: How do you ensure that users can log in? Focus on getting
InitUserandGetUserproperly designed, and don’t worry about file storage or sharing yet. Then, after you’re satisfied with your login functionality, move on to the file storage functions. Don’t worry about sharing yet, and just make sure that a single user is able toLoadFileandStoreFileproperly. Then, you can move on toAppendToFile. Finally, once you’re satisfied with your single-user storage design, you can move on to sharing and revoking. - Don’t be afraid to redesign. It’s normal to change your design as you go. In particular, if you follow the order of functions in the spec, then
AppendToFilemight result in changes toLoadFileandStoreFile. Also,RevokeAccessmight result in changes toCreateInvitationandAcceptInvitation. It’s easier to change your design while you’re in the design phase; by contrast, it’s harder to change your design after you’ve already implemented it in code.
Coding Workflow
Please refer to Getting Started Coding to get started coding (downloading GoLang, etc).
- Stay organized with helper functions. If you fit all your code in 8 functions, it’s easy for the functions to get bloated and hard to debug. By contrast, if you organize your code into helper functions, you can reuse code without needing to copy-paste code blocks, and you can also write unit tests to check that each helper function is working as intended.
- Test as you go. Don’t write a huge chunk of code and then test it at the end. This usually results in a failed test, and now you have no idea which part of the giant code block is broken. Instead, write small pieces of code incrementally, and write tests as you go to check that your code is doing what it’s supposed to.
- Don’t split the coding between partners. Sometimes, a 2-person project group will try to have each group member independently write half of the functions. As a design-oriented project, the code in different functions will often be connected in subtle ways, and it is difficult (if not impossible) to write code without understanding all the code that has been written so far. A better approach is to work together to figure out the high-level organization of your code. Ideally, you’d use a technique like pair programming to ensure that both partners understand the code being written. The only scenario where writing code individually might be useful is for isolated helper functions, where the behavior is clearly documented and the function can be tested and debugged in isolation. Staff are not responsible for helping you understand code that your partner wrote.
Development Environment
Visual Studio Code (VSCode)
VSCode is a very commonly used IDE, and provides a powerful set of code and debugging environments that can be exploited for Golang Projects. To setup VSCode for this project, follow these steps:
- Install Golang. Make sure you have Golang installed before starting this guide.
- Install the GoLang extension. In the “Extensions” tab (Use Ctrl+Shift+X to navigate you can’t find it), search up the Go extension that is created by Google.
- Install the debugging environment Once the extension is installed, the lower right corner might and most likely will pop up a warning stating that analysis tools might be missing. If so, click on the install, and wait for the analysis tools to install. If you missed this the first time, press (Ctrl+Shift+P) and search up “Extensions: Install Missing Dependencies,” and follow the instructions.
Debugging in VSCode
Once the extensions are installed we can now follow the debugging flow:
- Set breakpoints. To set a breakpoint in your code, Navigate to the line where you want your breakpoint to be, and click on the left side of the line number. You should see a red dot appearing next to the line number, which indicates that a breakpoint has been set.
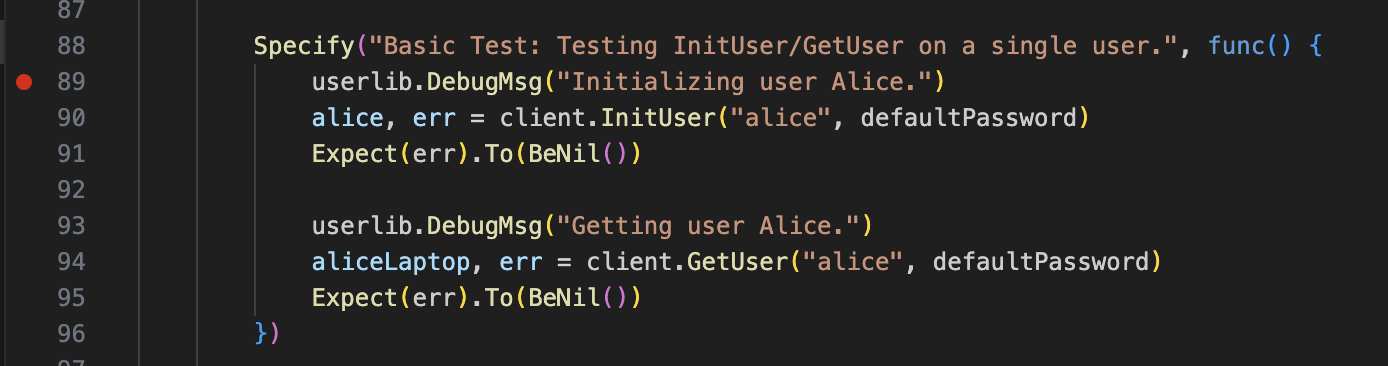
- Run a test. To debug a test case and peek around the breakpoint, navigate to the
client_test/client_test.gofile, and click on thedebug testbutton above the test case that you want to run. Immediately after, the debugger will start. If your debugger doesn’t pause at breakpoints you’ve set, this means that your code flow never went through any lines of code that you’ve set a breakpoint on.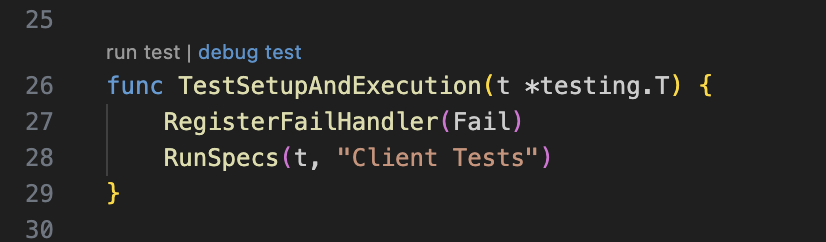
- Navigate the debugger. The golang debugger has a really convenient and powerful interface. There are a couple sections you should especially be aware of:
- You can step through your code using the menu bar at the center top of the screen just above the code editor (outlined in blue in the image below). Hover your mouse over each function to see the keyboard shortcut for each of these. This is a very important feature, so get familiar with each and every button.
- You can use the
local variablesat the top left quadrant of your screen (dash outlined in red in the image below), which displays the variable name and their values. For nested structures, you can click the expand button to view variables inside the struct. - You can use the
watchsection at the middle left quandrant of your screen (circled in green in the image below) to constantly evaluate golang expressions. Some of the thing you can use it for is to constant check the length of an array, which you can do withcall len([variable]). To constantly evaluate functions, you need to append the function call withcallfor watchpoints. - You can check the call stack in the
call stacksection, and edit breakpoints in thebreakpointssection.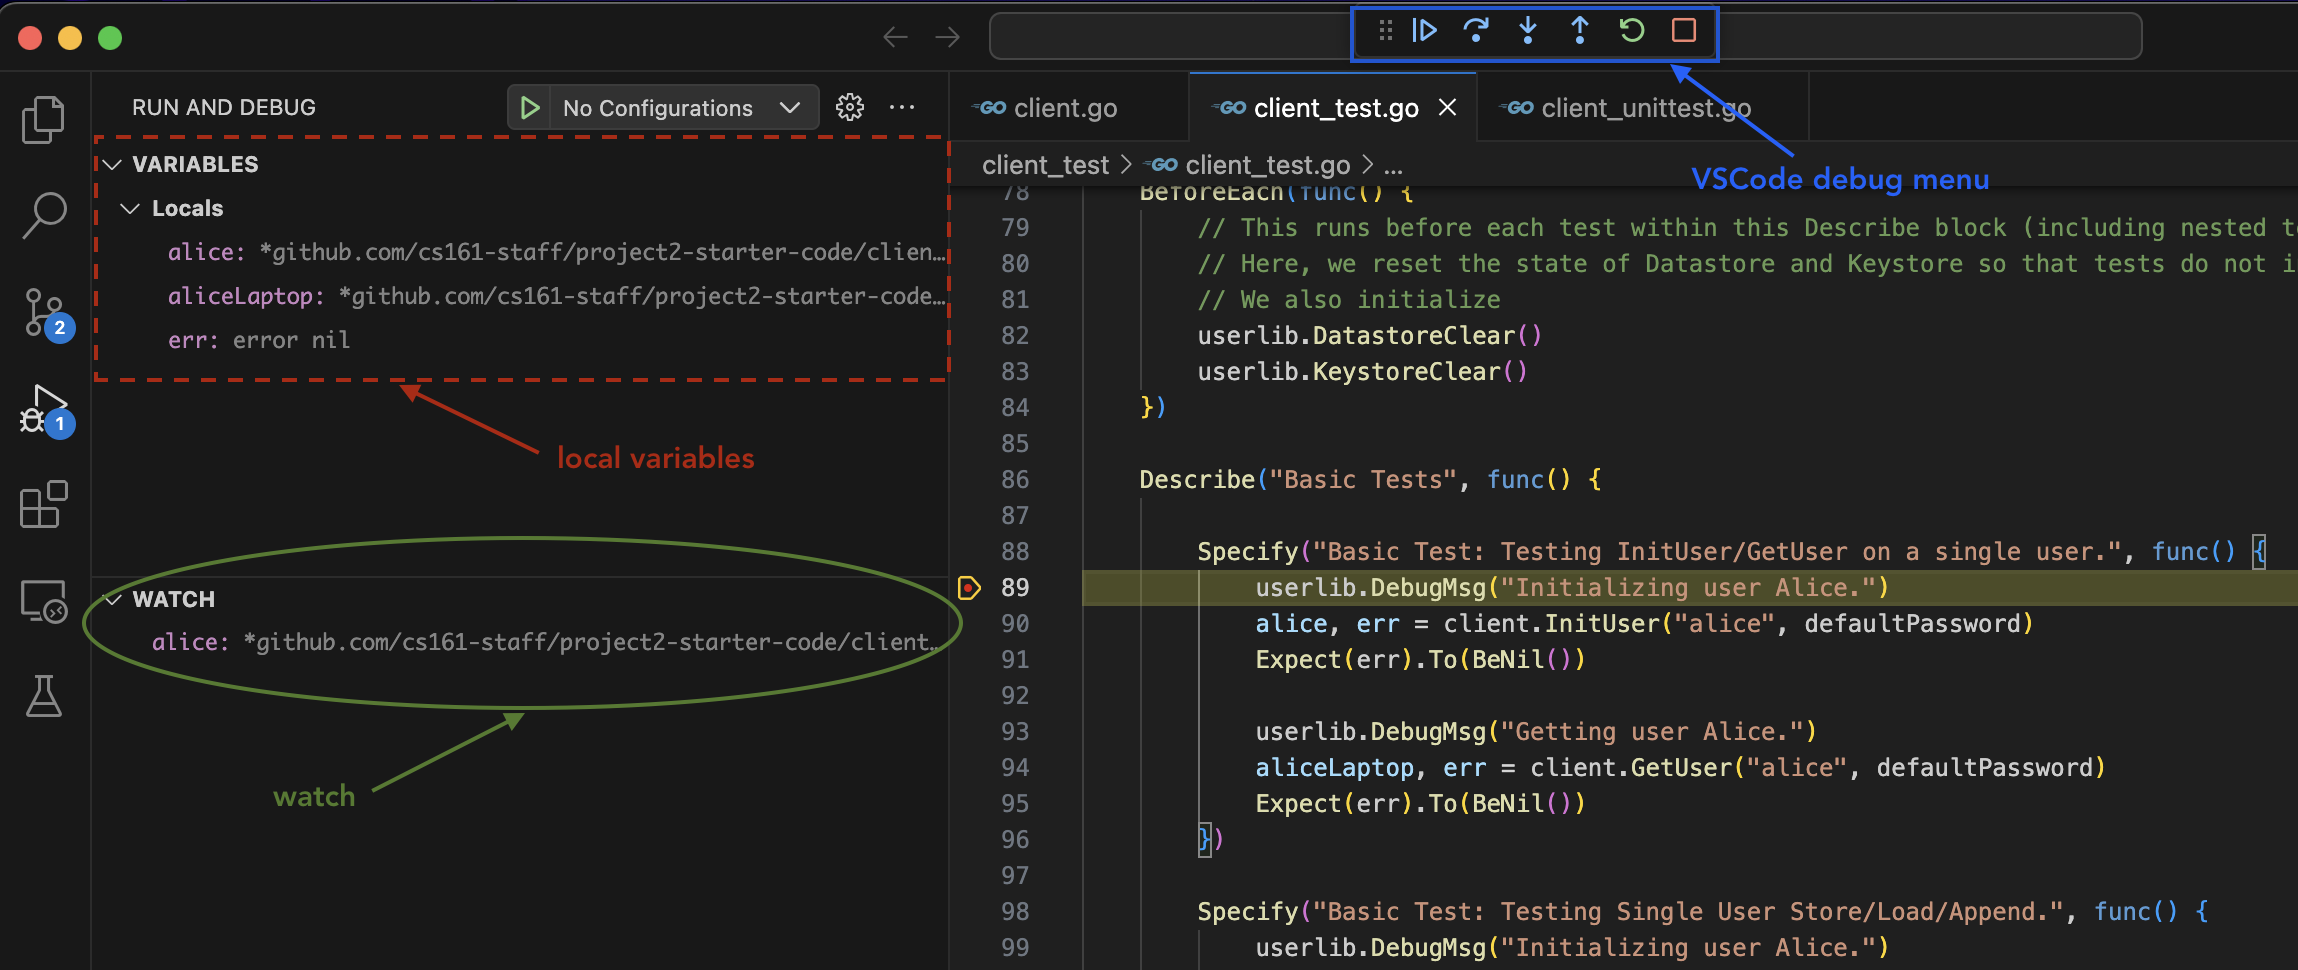
Testing with Ginkgo
This section provides some basic documentation for Ginkgo, which is the framework you’ll be using to write your own test cases.
First, we recommend reading through the basic tests in client_test.go, especially the first few ones, since those are well-documented in-line. Then, come back to this documentation.
Basic Usage
You should be able to write most of your tests using some combination of calls to –
- Initialization methods (e.g.
client.InitUser,client.GetUser) - User-specific methods (e.g.
alice.StoreFile,bob.LoadFile) - Declarations of expected behavior (e.g.
Expect(err).To(BeNil()))
Asserting Expected Behavior
To assert expected behavior, you may want to check (a) that an error did or didn’t occur, and/or (b) that some data was what you expected it to be. For example:
// Check that an error didn't occur
alice, err := client.InitUser("alice", "password")
Expect(err).To(BeNil())

// Check that an error didn't occur
err = alice.StoreFile("alice.txt", []byte("hello world"))
Expect(err).To(BeNil())

// Check that an error didn't occur AND that the data is what we expect
data, err := alice.LoadFile("alice.txt")
Expect(err).To(BeNil())
Expect(data).To(Equal([]byte("hello world")))

// Check that an error DID occur
data, err := alice.LoadFile("rubbish.txt")
Expect(err).ToNot(BeNil())
Organizing Tests
You can organize tests using some combination of Describe(...) containers, with tests contained within Specify(...) blocks. The more organization you have, the better! Read more about how to organize your tests here.
Optional: Measure Local Test Coverage
To measure and visualize local test coverage (e.g. how many lines of your implementation your test file hits), you can run these commands in the root folder of your repository:
go test -v -coverpkg ./... ./... -coverprofile cover.out
go tool cover -html=cover.out
Coverage over your own implementation may serve as an indicator for how well your code will perform (with regards to coverage flags) when compared to the staff implementation! It should also help you write better unit testing to catch edge cases.